

“Up, Up and Away” is appropriate when Superman takes off for his next flying adventure. It’s also applicable describing the economic backdrop of the second quarter 2021. It is hard to find any economic data point that doesn’t support accelerating economic conditions1.
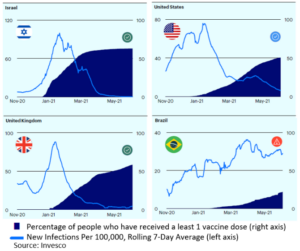
The uniqueness of the economic recovery comes directly from the cause of the economic downturn, the COVID contagion. The downturn was a result of a health pandemic and not the more typical signs of economic exhaustion. A fair argument would suggest a COVID inoculation would result in an economic revival. In fact, that has proven to be the case. Countries with the quickest inoculation efforts enjoyed the fastest economic recovery. Israel, U.K. and the U.S. led the way with India, Brazil and South American countries to name a few failing to organize a rollout plan and suffering from it.
The only surprise of this economic recovery was the swiftness in which it transpired. Americans wasted no time returning to their favored activities and even exploring new interests. The safety of vaccination and pent-up demand led to a quick ascension of restaurant dining, travel demand and National Park visitations. Add to this the typical cyclical aspects of Spring fever and Summer activities (i.e. school year completion and summer vacations) and the result is a massive and rapid desire for experience related services. The inability for supply to quickly respond contributed to price imbalances.
A close look at consumers and businesses suggest both are prepared for further growth. Consumers are in the best financial situation not seen in many years. Levels of cash are high and debt service is low. This has also led to risk taking as demonstrated by the popularity of cryptocurrencies, SPACs, NFTs and day trading.
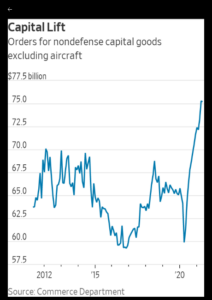
Businesses are also in very good shape with an eye towards a promising future. Businesses investing in themselves has always been a good indication of outlook confidence. A proxy for business investment is nondefense capital goods orders, which is significantly higher than at any time in the past 10 years. Translation, even with the near-term headaches, the future looks bright.
INFLATION
Inflation has been a buzz word throughout the second quarter. Higher transitory inflation was an expected near-term temporary outcome due to how inflation is calculated as well as supply bottlenecks. Inflation is the price change from a previous period. Recall a year ago, prices dropped precipitously as consumer demand dried up due to a shuttered economy. The artificial lower prices of 12 months ago became the “base” of today’s heightened reopening prices. This has been referred to as the “base effect.”
As mentioned above, supply of goods and services can’t respond as quickly as demand commands. In the simple aspect of hiring, a company needs to post a job, evaluate applications, make an offer and train the employee before the new employee can contribute to the business. Whereas, demand can be turned on and off like a light switch. This demand/supply mismatch can impact prices during the mismatch period. Hence, the supply/demand mismatch has added to this temporary transitory situation.
Due to the asynchronous vaccine rollout and COVID response hangover, aspects intended to assist fellow Americans have become impediments during the reopening. Business leaders (mainly small business leaders2) and regional Federal Reserve Districts have noted the difficulty attracting workers even as job openings have reached all-time highs. Job openings tracked by the Bureau of Labor Statistics are not just at all-time highs, but significantly higher than previous highs3. The lack of workers has extended supply chain bottlenecks and contributed to the near-term inflationary pressures.
Is inflation here to stay? Likely not. The base effects and supply chain bottlenecks are transitional situations. Reported inflation measures have ticked up, but those are historical by nature. Treasury breakeven yields give insight into future inflation expectations. Current decreasing breakeven yields suggests inflation is a near-term transitionary issue. Of note is the level of Federal spending, which is stimulative in the near and intermediate terms, could contribute to long-term inflationary pressures.
EQUITY MARKETS
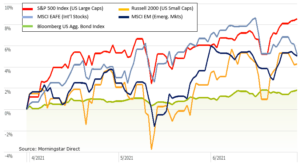
The U.S. equity markets have led the way through much of the pandemic and continued through the second quarter. This has led to elevated U.S. stock market valuations. A low interest rate environment could support higher valuations, but higher valuations also make U.S. stocks more sensitive to news.
The COVID vaccination progress is the primary driver of today’s rebound. Although Europe’s initial rollout attempts were lackluster, European vaccinations are underway and catching up quickly. Europe, heavily dependent on tourism, is beginning to open their borders and ports. In a parallel effect, a broader global economy will likely reintroduce the appeal of foreign currencies. Both aspects may contribute to international stock performance.
BOND MARKETS
Media personnel took time to talk about higher interest rates, but they must have forgotten to check the tape. The second quarter’s interest rates fell, meaning bond values rose. (Bond prices are inversely related to interest rates.) Stabilized bond prices and yields are further evidence that the bond market believes recent inflation data is likely short lived and offers confidence in the economic outlook.
No one can predict how the reopening will unfold. In addition to overcoming COVID, consumer preferences are changing, and new business paradigms are being implemented. This is why we prefer diversified portfolios across multiple asset classes. Bonds offer diversification, income and stability during volatility events while equities offer growth to hedge long-term inflation.
Enjoy your summer vacations as COVID diminished your 2020 summer enjoyment. Happy 4th of July weekend! Warmest regards.
The opinions expressed are those of Heritage Financial and not necessarily those of Lincoln Financial Advisors Corp.
The S&P 500 index measures the performance of 500 stocks generally considered representative of the overall market. NASDAQ Index measures the performance of the 100 largest non-financial securities listed on The NASDAQ Stock Market.
1 wwwfederalreserve.gov; www.bea.gov
2 National Federation of Independent Business (www.nfib.com)
3 Job Openings and Labor Turnover Survey Home Page (bls.gov)
CRN-3659630-070621
Recent Comments