
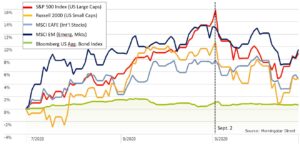
The third quarter experienced a bit of confidence followed by a bout of gloominess. July and August saw unfettered optimism as the business reopening began, accompanied by data exhibiting people’s desire to return to normal. September followed the historical record, which tends to be a lack luster month. Most equity markets peaked on September 2nd. The S&P 500 and NASDAQ which led in the July & August runup also led in the September decline.
The renewed September volatility follows an extended period of relative stability in the markets driven by a mostly positive narrative. Infection and death rates from COVID started to fall across the globe. Economies started to open up which quenched pent-up demand for goods and services as well as desires to alleviate cabin fever. China and Europe had seemingly proved to the world that the virus could be defeated if countries were willing to follow the proper protocols. The COVID vaccine news flow contributed to optimism, including the news that several different drug companies were entering phase three trials. There was even speculation that a couple of vaccines might become available by year end or even by the end of October, which is likely wishful thinking.
The better-than-expected pandemic news started to translate into greater optimism about the pace of economic recovery. U.S. data supported that notion. Jobs were added at a better pace than initially expected. Consumer spending was buoyed by stimulus checks, enhanced unemployment benefits, and forbearances on monthly mortgage and loan payments. Businesses were supported by ready access to low-cost loans from willing lenders through government-backed bank loans and through public markets witnessed by high bond issuance. Inflation was low to non-existent, which influenced the low levels of short and long-term interest rates. Following a -9.0% GDP decrease in the second quarter (-31.4% annualized¹), the third quarter rebound took many economist and investment professionals by surprise. So much so, that many revised their GDP projections for the second half of 2020 substantially higher.
Two months into the quarter, the high valuations of the FAANGM (Facebook, Apple, Amazon, Netflix, Google (Alphabet) and Microsoft) stocks couldn’t be sustained, leading the markets south. At the same time, the news cycle pivoted to non-economic concerns, such as social unrest, presidential election bantering, return to school and contemplation of a COVID second wave. The relative concerns cause investors to seek the safety of the U.S. dollar, which is typical during times of uncertainty. The U.S. dollar is considered the most stable and secure currency in the world.
Short-term interest rates remained low by way of the Federal Reserve (The Fed). The Fed has pulled out all the stops to support the economy. The central bank has grown its balance sheet through asset purchases and cut short-term interest rates to zero while imploring Congress to step up fiscal stimulus. Stable longer-term rates suggest long-term confidence. The Fed’s announcement to “average” 2% inflation rather than targeting 2% inflation could cause bond market speculation down the road. Something to monitor in the coming months and years.
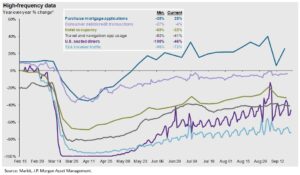
Many traditional economic indicators have struggled to keep up with the economic realities on the ground. Higher frequency economic activity indicators provide a glimpse into different industries to understand the progress and success in reopening the economy. So far, housing (measured by mortgage applications) or “socially distant” transportation (like driving measured by driving direction usage) have recovered well. Hotel occupancy and global travel have begun to pick up slightly but are still well below pre-COVID levels. Restaurants and travel, measured by U.S. seated dinners and TSA traffic, appear to have a long road ahead.
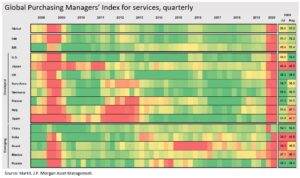
Developed and emerging market economies followed similar paths, with few holdouts. Desires to get back to “normal” have propelled business managers’ outlook from bleak to very positive in just a month or two. Swings of this nature (from red to green in the chart) are almost unheard of. More typical is a gradual warm up (moving from red to orange to yellow to green).
The investment markets are continually dealing with ambiguity. Focus on the fundamentals and longer-term trends helps mute the near-term noise such as presidential wrangling, vaccine timeline and China trade tensions. All of which can contribute to investor angst. We’ve come a long way on this road to recovery, but no road is absent potholes or construction zones. Keeping focused on the long-term helps maintain the right perspective and reduce anxiety.
Thank you for your continued trust. Please don’t hesitate to call or email us should you have any questions or just want to talk.
¹ https://www.bea.gov/sites/default/files/2020-09/gdp2q20_3rd.pdf
The S&P 500 index measures the performance of 500 stocks generally considered representative of the overall market. NASDAQ Index measures the performance of the 100 largest non-financial securities listed on The NASDAQ Stock Market.
CRN-3266732-100220
Recent Comments