The second quarter can be described as a rollercoaster given the turbulent ups and downs. It might be better characterized as a mini-market cycle complete with oscillating economic data, varied industry–wide market prognostications, dashed interest rate hopes, and external influences such as global trade threats, geopolitical strife, and an aggravated Mideast conflict. Sounds like a decade of news packed into just three months. News that translated into market volatility.

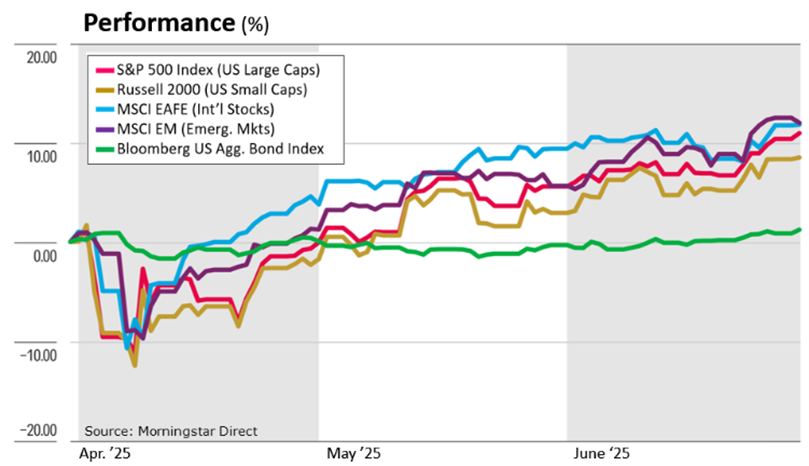
April 2nd’s “Liberation Day” tariff announcement kicked off the quarter, causing a sharp decline across financial markets. The U.S. president’s administration softened its tariff stance and ultimately postponed tariff implementation for 90 days. Yet, the damage had been done with headlines, not actual financial or economic data, taking the reins of the financial markets’ ups and downs.
The administration was also active in foreign policy. The U.S. reached a minerals deal with Ukraine in exchange for aid, though peace talks with Russia stalled. In the Middle East, tensions flared between Israel and Iran, which was capped off by U.S. military strikes on Iranian nuclear facilities. Fears that a broader conflict in the region would disrupt global energy markets proved short-lived after tensions quickly simmered.
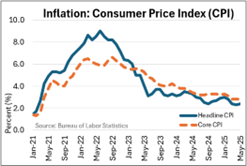
On the economic front, sentiment surveys of consumers and businesses reflected uncertainty amid the highest looming tariffs since the 1930 Smoot-Hawley Tariff Act. However, the U.S. economy remained resilient: the unemployment rate was virtually unchanged, and inflation softened. First quarter’s Gross Domestic Product (GDP), reported on April 30th, dipped into negative territory, driven primarily by wild swings in imports as companies prepared for “Liberation Day.” Yet, core measures of economic activity such as consumer spending and business investment remained on solid footing.
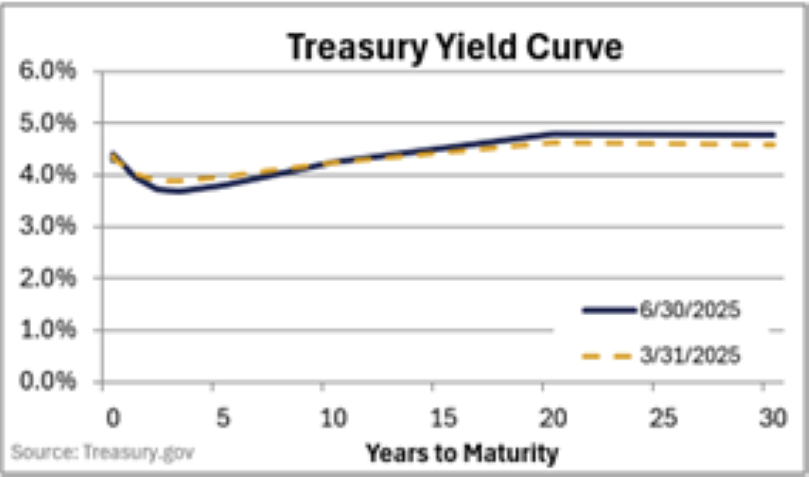
The Federal Reserve (Fed) kept rates unchanged in Q2, adopting a wait-and-see approach to ascertain if tariffs posed a greater risk to inflation or growth. The Fed’s stance differed from central banks around the world, which began rate-cutting cycles to accelerate economic activity. The Fed’s indecision added to market volatility. Recent Fed comments suggested two rate cuts by year-end, echoing market expectations.
Easing global inflation has continued longer

trends. Many countries are experiencing inflation approximating or below the 2% targets on a year-over-year basis. The near-term month-over-month trend is demonstrating disinflation (i.e., minimal inflation) or even deflation (i.e., falling prices).
EQUITY MARKETS
The market has been following our playbook. Since the front side of the fourth quarter of 2024, we have been suggesting a broadening of the market away from the Magnificent 7 (Mag 7) across more industries and sectors. We have seen a broadening market gain momentum throughout the first half of 2025. The Mag 7, in aggregate, finished in negative territory while the broader S&P 500 was in mid-single-digit positive territory. Tesla and Apple were the worst Mag 7 performers.
The broadening has not been as strong down market. Smaller companies are more sensitive to moderating economic data as well as dour forecasts due to weaker financials, niche product/service offering, regional focus, and limited brand recognition. Prognostications calling for trade dislocations (hence, supply disruptions), tariffs redirecting consumer dollars, and possible trade wars held smaller companies behind. In light of this, smaller companies still posted positive returns.
International stocks, Eurozone stocks specifically, increased their lead during the second quarter. International stocks, especially Eurozone stocks, had the benefit of beginning the year with a “poor” consensus outlook. Hence, anything better than “poor” supports stock returns. Our focus on Euro stocks has played well for our clients so far this year. International and emerging stocks also had the benefit of a falling dollar. To U.S. investors holding foreign stocks, a falling dollar is accretive to stock returns, a dynamic we’ve been advocating for the past year.
FIXED INCOME MARKETS
Fixed income classes returned to their traditional relationship with stocks. Bonds provided some shock absorption to the stock market’s early April downturn. Thereafter, the bond market gave way to Federal Reserve policy uncertainty, talk of rekindled inflation, and widening fiscal deficits. The trend reversed mid-quarter as the credit market threats dissipated. Corporate bonds outperformed

Treasury bonds in Q2, with lower-quality corporate bonds outperforming. Corporate bonds, particularly high yield, benefited as tensions eased and investor sentiment improved.
The municipal bond market was weighed down by the Trump administration’s unknowns: taxes, spending, deficits, higher education, immigration and sanctuary cities, on-again off-again tariffs, among other issues. Much of this will be settled with the recent passage of the Big Beautiful Bill on July 4th and should provide confidence to the municipal bond market going forward.
CONCLUSION
Investors are certainly glad to see the closure of the second quarter. Tariff nerves, amplified trade war prognostications, military strikes and war, interest rate policy ambiguity, central bank divergence, and conflicting economic data permeated the quarter. Investors became callused to volatility’s origins, ultimately resulting in equity markets clocking new highs and stabilized bond markets. Financial markets began focusing on the resilient economic data and company earnings instead of the prognosticated doldrums. In hindsight, headlines became the main cause of unnecessary volatility. The main lesson for the second quarter is to be wary of headlines and prognostications.
The opinions expressed are those of Heritage Financial and not necessarily those of Osaic Wealth, Inc. Forward looking statements may be subject to certain risks and uncertainties. Actual results, performance, or achievements may differ materially from those expressed or implied. S&P 500 index measures the performance of 500 stocks generally considered representative of the overall market. Russell 2000 measures the performance of US small cap stocks. MSCI EAFE measures the performance of large and mid-caps of developed markets excluding the US and Canada. MSCI EM measures the performance of the large and mid-caps of emerging market equity securities. Bloomberg US Aggregate Bond index measures the performance of US investment grade bonds, including Treasuries, government agencies, corporates, MBS and ABS.


Recent Comments