
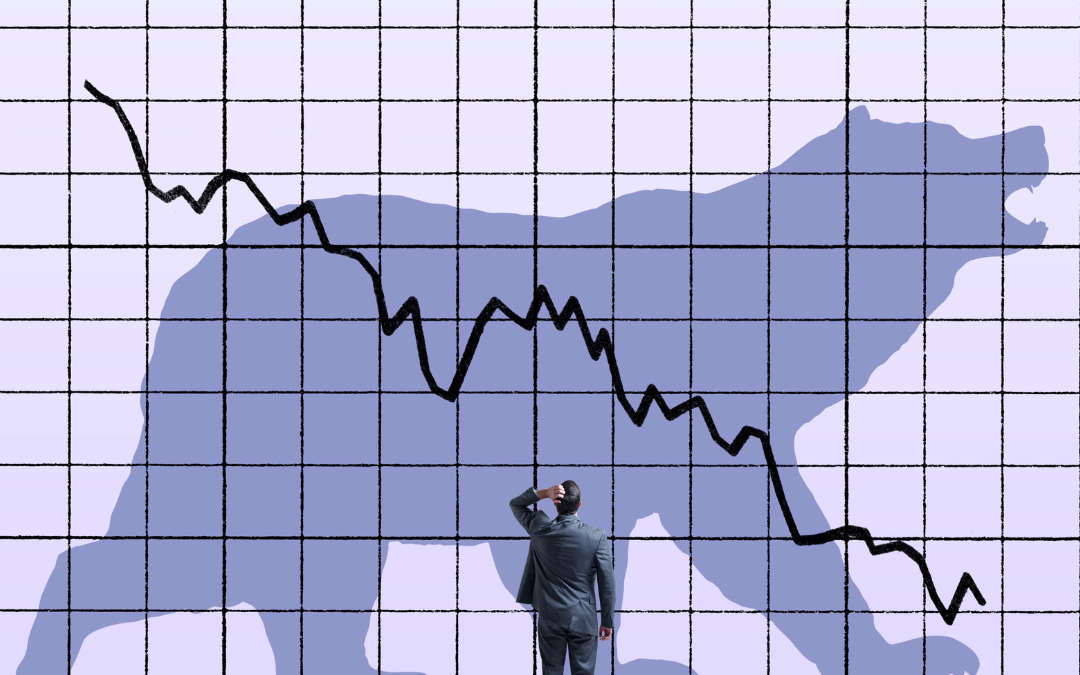
 The first half of the year is coming to a close… and it’s been a bear! A bear market is defined as pullback of at least 20%. The most recent bear markets (2011, 2018 and 2020) lasted between 1 – 5 months1. Hence, investors have been conditioned to expect brief declines. During the current environment, large company stocks are approaching a six-month decline while smaller and international stocks are approaching an eight-month pullback1. Investor anxiety is understandable.
During these prolonged declines, it is easy to say, “no more.” If you are feeling this way, you are not alone. Reaching a point of surrender is often easier than staying in the game striving for your goals and objectives. Part of our job is to help you from making the big mistake. In this case, making a decision detrimental to your long-term financial health could be a big mistake.
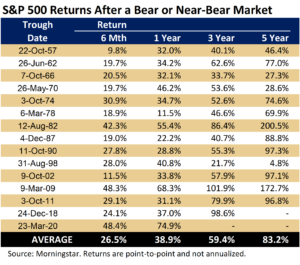
We have complied data since 1950 to bring some perspective and reason to help you through this period. The accompanying table shows the 15 bear or near-bear markets since 1950. You will notice once the market has bottomed, it tends to move higher rather quickly; with the average 6-month and 1-year returns experiencing major upswings. Admittedly, no one knows when the bottom will occur, but it will occur.
An understanding of market statistics reveals that good returns tend to be clustered with poor ones. Various theories attempt to explain this phenomenon; from the changing economic picture, to overcompensating investor psychology, to natural shocks that emanate from the creative destruction dynamic of progress. Whatever the catalyst, the trend is the same… good times cycle to poor times which cycle to good times with timing and duration being unknown.
The stock market is said to be a forward-looking mechanism as investors attempt to deploy capital for future profit. Research has shown the stock market tends to anticipate events 6 – 12 months in advance, which is why stock market performance is part of the Leading Economic Indicators. If the market is projecting a recession as a base case, it could soon be looking for the next economic step… recovery.
At the same time, low valuations attract investors to buy stocks. Buying a winter coat in the summer, when it is not needed, may fetch the buyer a 50% discount. Low stock valuations entice investors in the same way. Recent stock valuations are at lows not seen for some time. The combination of forward-looking anticipation and low valuations often occur when despair is abundant, not too different from the current feeling. This is why market inflection points often take people by surprise.
History may not repeat itself, but it tends to rhyme. Market statistics provide the backdrop to our capital market assumptions and your portfolio development. Please do not hesitate to reach out if you need to chat.
The opinions expressed are those of Heritage Consultants and not necessarily those of Lincoln Financial Advisors Corp. The S&P 500 Index is the Standard & Poor’s Composite Index of 500 stocks and a widely recognized, unmanaged index of common stock prices. You cannot invest directly in an index. Forward looking statements may be subject to certain risks and uncertainties. Actual results, performance, or achievements may differ materially from those expressed or implied. 1Data from Morningstar.
CRN-4803072-062322
Recent Comments