

September is here. Do you know what that means? Get ready for the September slump. September has historically been the worst stock market performing month.
CFRA research has examined monthly returns since 1945 and found September had the worst monthly performance, negative -0.6%1. Further, CFRA also found September was negative 56% of the time1,
There are a few theories as to why September is traditionally so weak. For starters, many investors return from their summer vacations reassessing their portfolio positioning. Second, corporate budgets are also prepared for the coming year, with companies debating whether to tighten their belts or not. Third, near the end of their fiscal year, mutual funds often will engage in window dressing by selling positions they hold at a loss to reduce the size of their capital-gains distributions.
September is just one of many seasonal patterns that investors are watching heading into the fall. Another issue plaguing stocks is U.S. midterm elections. The stock market tends to struggle early in midterm years due to the potential for policy changes in Washington, but then tends to rally at year-end once the results are in. So far, this year has undoubtedly followed the normal midterm pattern. Only time will tell if this chronological pattern is fulfilled.
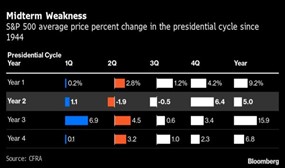
For those that watch technical cycles, the presidential election cycle theory could be on the radar. This theory posits that equity market returns follow a general pattern each time a new U.S. president is elected. According to this theory, U.S. stock markets perform weakest in the second year; then recover, peaking in the third year; before moderating in the fourth and final year of the presidential term; after which point the cycle begins again with the next presidential election.
Some investment patterns are worthy of attention while others are not. Of the last eight completed presidential cycles (since President George H.W. Bush), four followed the presidential cycle pattern and four did not. In other words, simply following the pattern would give you the same odds of flipping a coin. Maybe the presidential cycle pattern is one of coincidence and not a valid investment strategy.
The main takeaway is… be careful of the implementation strategy used. Some may seem well reasoned while others are based on coincidental relationships.
1Source: CFRA
CRN-4945359-091222
Recent Comments